The Certified Financial Planning Board provides the following definition and process[1]:
WHAT IS FINANCIAL PLANNING? Ethical, competent financial planners bring together the different parts of a client’s financial life to build a roadmap for the future. That’s why developing deep subject matter expertise – in these areas and more – is critical to the role.
- BASICS OF FINANCIAL PLANNING: Mastering financial, economic and cash flow/debt management concepts.
- INVESTMENT PLANNING: Building a portfolio, including different investment vehicles, diversification and risk management.
- RETIREMENT SAVINGS & INCOME PLANNING: Performing retirement needs analyses, evaluating retirement plans, and understanding Social Security, Medicare and Medicaid.
- TAX & ESTATE PLANNING: Understanding laws and management techniques around taxes, property transfer and estate planning.
- RISK MANAGEMENT & INSURANCE PLANNING: Evaluating risk and assessing different types of insurance, from healthcare to property to disability.
- PSYCHOLOGY OF FINANCIAL PLANNING: Address client behavior and attitudes related to financial planning.
Ripsaw® recognizes that all these components are not separate decisions but require a simultaneous set of decisions that are unique to you. In fact, there are many obvious tradeoffs among these decisions. Spending more now is good for a higher current standard of living now but leaves less for retirement and other goals. Saving more now means less pleasure today but potentially more available in the future. A more aggressive investment strategy for higher expected wealth may come with more risk of not achieving your goals. A conservative investment strategy with low expected wealth accumulation and very low risk may also not achieve your goals. Poor decisions on taxable gains/losses, location of assets (i.e., taxable versus tax deferred accounts) and expenses will be a major drag on wealth accumulation and potentially not achieving your goals. How long will your savings last in retirement? What joint strategy has a sufficient probability of goal success? Like health security, financial security is very important to your comfort level and overall well-being.
Ripsaw® is built to use on your own, Do-It-Yourself (DIY), or in collaboration with a professional advisor/planner. Furthermore, all plans need to be revisited and revised throughout your lifetime. Personal goals and opportunities change. Several goals may only have a trivial probability of success. Not suitable. Even with all these variables and tradeoffs, you can develop a realistic plan with confidence! Ripsaw® Wealth Tools has a Lifetime Wealth Planning component. Members start the process during onboarding. Then, you can iterate in the My Plan/Benchmark section with live access to your financial picture with more available details and revisions.
During onboarding you fill out some straightforward information about yourself and your finances. Some answers are well-defined like your age. Others only need rough estimates that you will modify as you see the results of your initial answers. This is largely a “what if” exercise to help you get a feel for the probability distribution of lifetime outcomes associated with what the market for cash, bonds and stocks are offering now for the future. Then you can focus on a plan that gives you the most comfort.
Exhibit 1 is an example of inputs by Jane Saw, our example Ripsaw member. Jane was born on 9/24/1980, has a spouse, a current family portfolio of $300,000 and intends to retire at 65. At 65, Ripsaw® goes to the social security mortality table for Jane’s expected end of life and adds another 25% to that for a retirement planning period of 25.61 years. Any of these inputs can be edited. Increasing the length of retirement for planning purposes is part of hedging against living beyond your means. If Jane is in much better health than her cohort, she might change the length of retirement to 30 or more years. If Jane is in poor health relative to her cohort, she might enter 20 or 15 years.
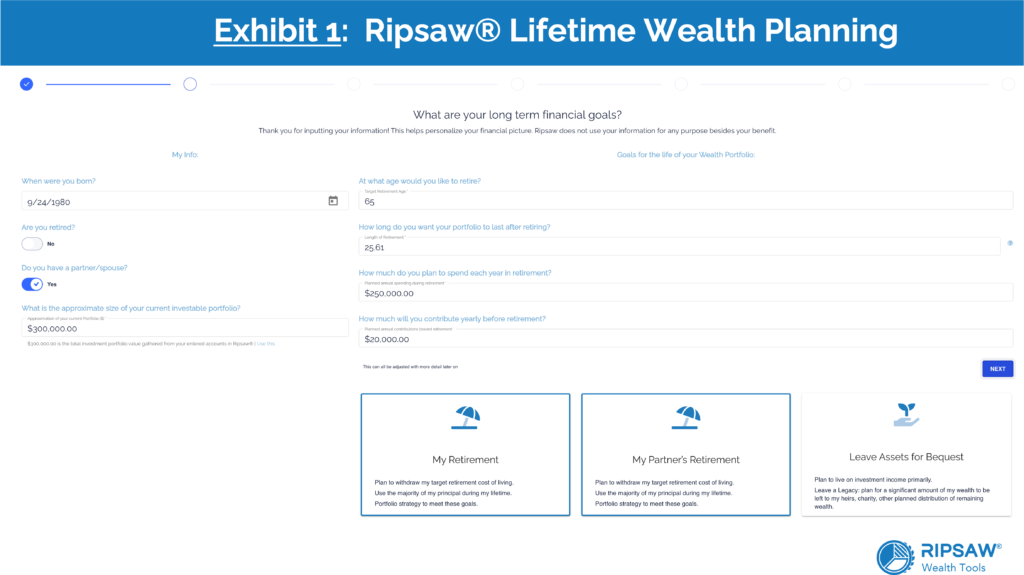
Jane entered $250,000 per year for spending in retirement and a commitment of $20,000 per year of savings for retirement. These inputs may be altered by Jane once we see the implications of them in combination with what the current cash, bond and stock markets are offering in terms of risk versus expected wealth for the short and long run.
There is an important distinction to make at this point. There is a tendency in the financial world to use the term “Risk Tolerance” for putting a client in an investment bucket, usually in terms of bond/stock percentages. More stock, more risk implying more expected return. That sounds logical, but the efficient frontier is not linear. It is a curve with a declining incremental expected return per unit of risk. There are parts of the curve where increasing risk is likely to be increasing downside risk faster than the benefit of increasing expected wealth. Furthermore, choosing a level of expected return you need to achieve your goals and be put in a bucket is also misleading. Currently the market may not be offering that number at a suitable level of risk. Just because you want it, doesn’t mean it exists. It is more satisfactory for individuals and families to think of choices among various expected wealth versus risk tradeoffs simultaneously with their lifetime planning goals.
After a few more onboarding information screens, Jane observes the first Lifetime Wealth Planning screen in Exhibit 2. “My Profile” on the left-hand-side of the screen contains Jane’s previous inputs. The graph in the middle combines these inputs with five distinct expected wealth versus risk tradeoffs from a US centric efficient frontier of low-cost index funds representing the cash, bond, and stock markets.[2] Initially, Ripsaw® will scroll through all five and land on the moderate expected wealth versus risk tradeoff.
The graph begins at Jane’s current age of 42 with a portfolio worth $300,000. The portfolio numbers at the end of the first year are calculated from Ripsaw®’s Short-term Market Analysis[3]. At the end of the first year, Jane’s portfolio is expected to grow in wealth to $348,434 (green curve intersecting with 1-year from now). This includes the return on investment as well as the additional savings for investment.[4]
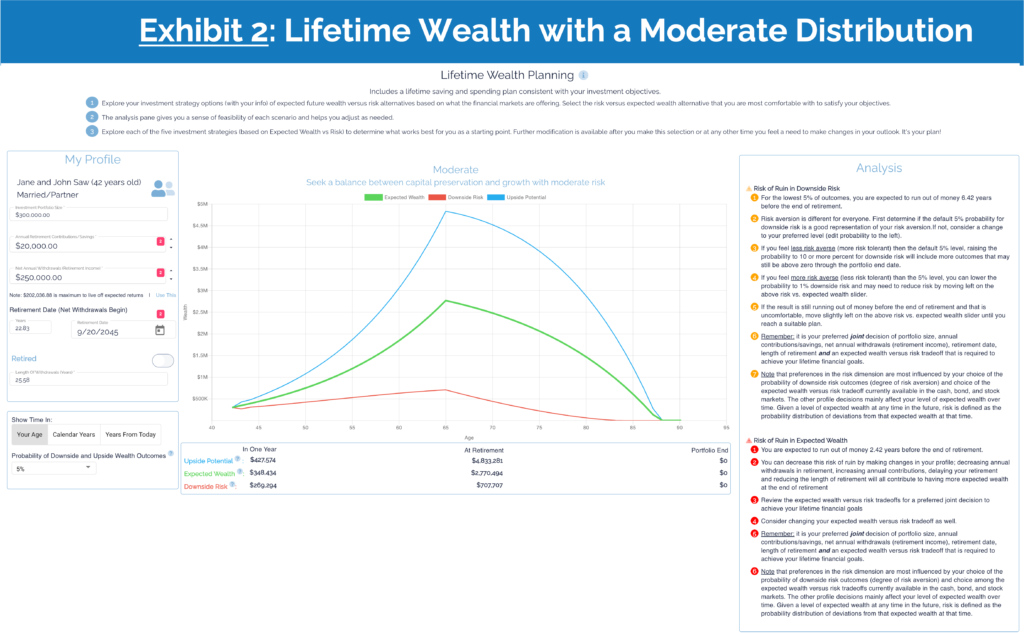
Risk is measured by potential deviations from this expectation, commonly summarized by the standard deviation statistic. Ripsaw® considers indicating downside risk and upside potential to be more informative in setting up a plan. The expected wealth of all outcomes in the bottom 5% of the distribution is $269,294 (red line in one year). That is downside risk with a 5% probability. At the bottom of the “My Profile” section is the 5% default value. From the drop-down menu, Jane could select a 1% probability to take out the less bad outcomes between 5% and 1% probabilities to focus more on the very worst outcomes. Or select higher probabilities that include more of the less bad downside outcomes above the 5% probability level. Given all the other inputs, the comfort level of downside risk probability is an indication of degree of risk aversion. More concern for 1% downside risk than 5% indicates greater risk aversion. 10% downside risk concern indicates less risk aversion than at 5%.
The upside potential of $427,574 (blue line in 1 year) is the expected wealth from all outcomes in the top 5% of the probability distribution. This is a probability weighted average of these outcomes implying that there are some above and some below this average. Same goes for downside risk with outcomes above and below $269,294. There are also many more outcomes (90% of the total) that are closer to the expected wealth of $348,434 between the 5% upper and 5% lower parts of the probability distribution at 1-year.
At the end of the first year, there is a kink in the three curves as the timeline switches from short-term (1-year) to long-term investment opportunities. There is also a very important kink in the graph when Jane would reach her intended retirement age of 65. That is the point when Jane switches from an accumulator (net saver prior to retirement) to a decumulator (taking money out to spend in retirement). The decumulation phase is typically thought of when spending exceeds the expected wealth increase from investment as it does look like in Jane’s tentative plan. If spending is below the expected wealth increase, then there will still be growth in expected wealth rather than the rapid decline we see here.[5]
At retirement, Jane’s expected wealth is $2,770,494. How long will that support withdrawals of $250,000 per year? Certainly, the downside risk outcome of $707,707 at retirement will not last long.
The “Analysis” block to the right of the graph alerts the user to some issues worth addressing in their financial plan. The downside risk alert indicates that for the lowest 5% of outcomes that Jane is expected to run out of money 6.42 years before the end of her retirement plan. You can see this in the graph where the downside risk red line flatlines at approximately 84 years old.[6] The second alert is for expected wealth going to zero 2.42 years before the end of her retirement. At the end of retirement, all outcomes are zero! The “Analysis” section also provides suggestions for finding a more suitable plan if this one is not.
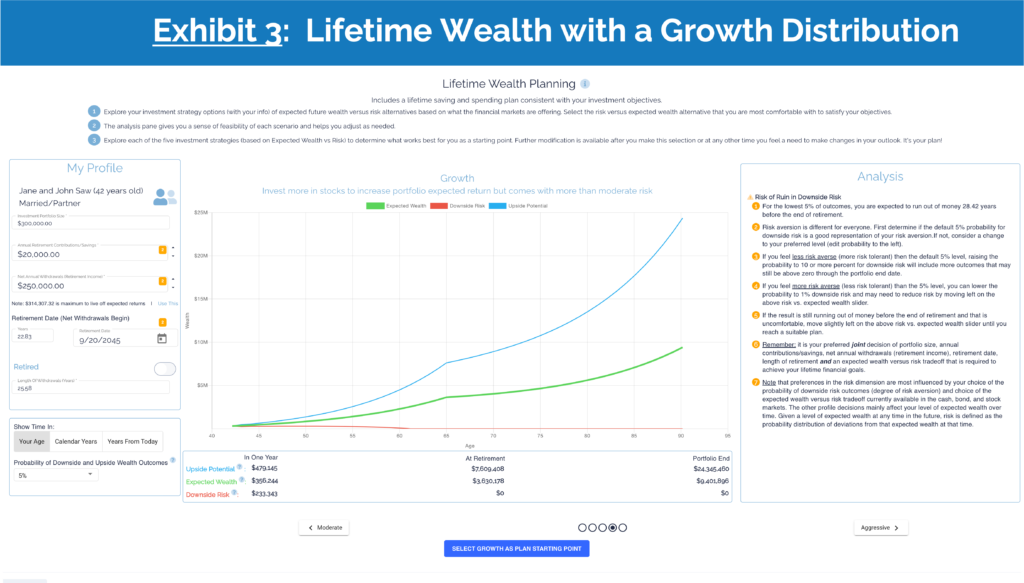
First, Jane begins by seeing if changing the expected wealth versus risk decision can help. Maybe more expected return on investments will get her to a better place. Moving from moderate to a growth distribution in Exhibit 3, the additional expected wealth and upside potential is higher, but downside risk is much worse. For the lowest 5% of outcomes, she is expected to run out of money 28.42 years before the end of her retirement plan. At 62, that is before retirement even begins! Even though expected wealth and potential upside are much higher, this potential disaster for downside risk is not worth it to Jane.
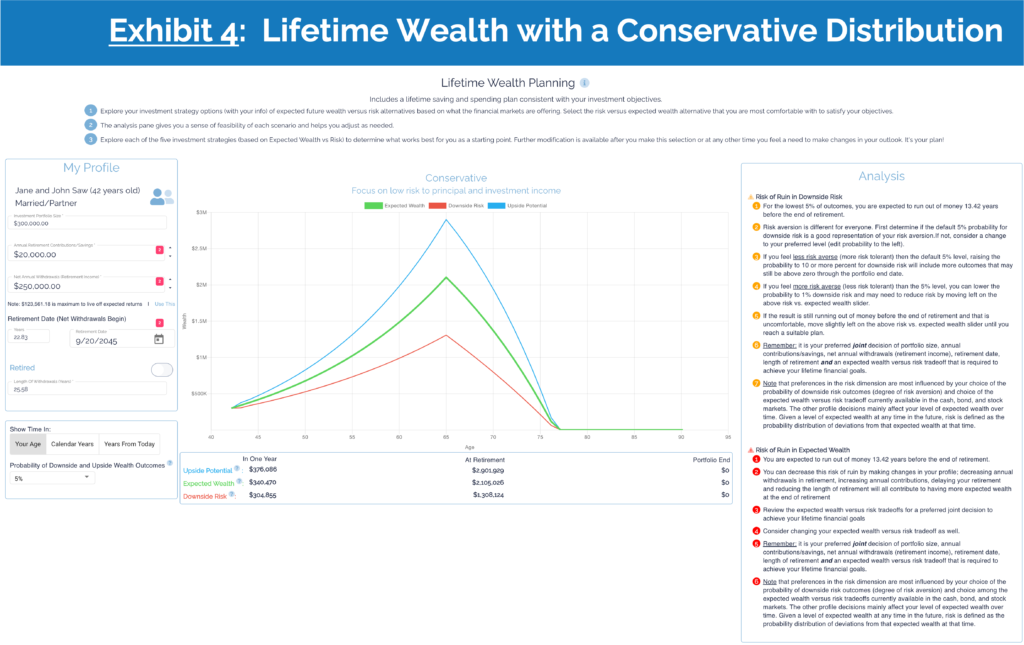
Considering a much lower risk strategy by moving to a conservative distribution in Exhibit 4 is also unacceptable with all three lines going to zero at age 77 (13.42 years before the end of her retirement plan. The lower expected returns over time cannot sufficiently support the level of withdrawals to the end of retirement. All zeros at the end of retirement.
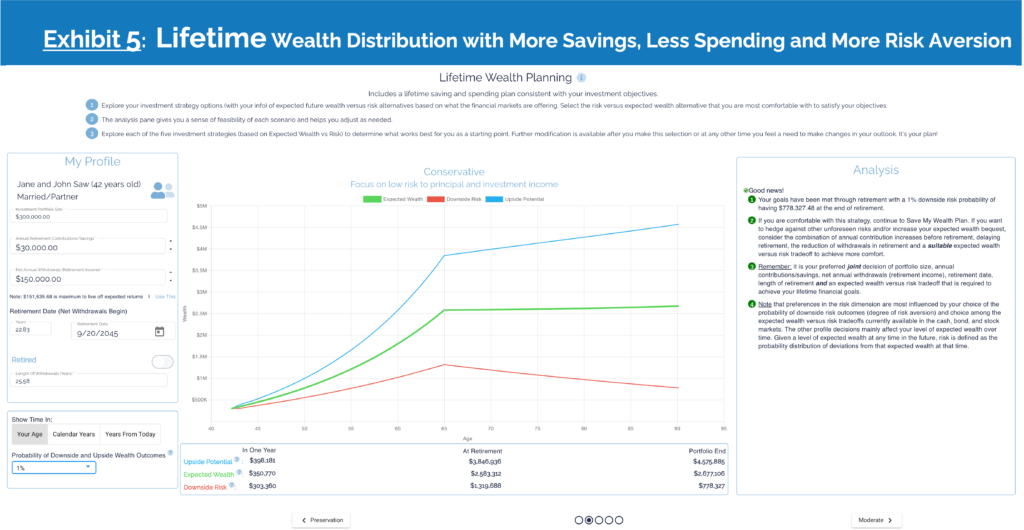
 Clearly, in the moderate, growth and conservative strategies the problem is that withdrawals in retirement are too large and savings for investment too small. Exhibit 5 indicates that a conservative investment strategy with an increase in annual retirement contributions to $30,000, withdrawing less at $150,000 per year in retirement, and with a more risk averse 1% probability for downside risk easily makes it through retirement with a high likelihood of a significant amount remaining for a bequest.
Now Jane is seeing a large cushion in her wealth distribution at the end of retirement, maybe she could spend more in retirement. Being relatively young, Exhibit 6 provides another alternative for reducing risk aversion to a downside probability of 10% and moving from a conservative to a moderate expected wealth versus risk tradeoff. In this part of the current efficient frontier, the benefit of an incremental increase in expected return can exceed that of the negative effect on downside risk.
Under the Net Annual Withdrawals entry is the maximum to live off expected returns entry. Either enter this number or click on “Use This” to enter $244,647.31. This is the amount for which you can expect to live off your portfolio expected returns. Note that the $3,354,803 of expected wealth at retirement is the same as at the end of retirement.
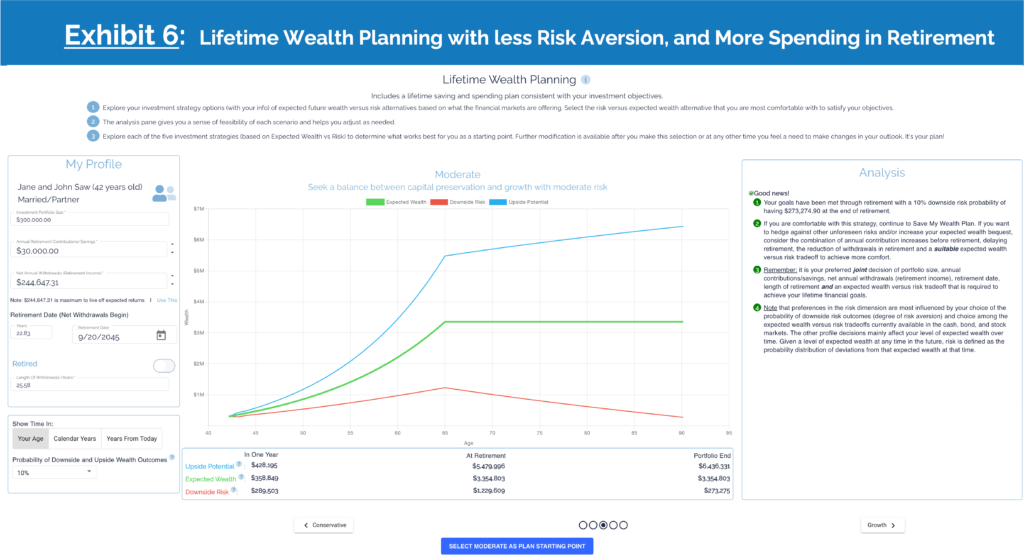
This combination of inputs has a downside risk outcome of $273,275 at the end of retirement which may be consistent with no obligation for a bequest.
Now she is enjoying a much larger withdrawal in retirement with much higher expected wealth and upside potential at retirement and at the end. Did Jane deceive herself to be able to withdraw more by lowering her risk aversion? What all users should do is establish their honest level of risk aversion for the probability of downside risk and stick to it as they change other inputs.
After reconsidering her risk aversion, Jane felt comfortable with a 10% probability for downside risk and the plan. Then she clicked on SELECT MODERATE AS PLAN STARTING POINT.
The additional feature available now is to have more incremental choice along the efficient frontier. 100 now instead of the previous 5. While Jane maintains a 10% probability for downside risk, she considers lots of other combinations of inputs. Exhibit 7 demonstrates that Jane is most comfortable with a commitment to save more before retirement, $40,000 per year, withdraw less in retirement, $200,000, and a slightly lower investment risk profile than Moderate. Jane prefers a larger safety net with a little less risk and a loftier expected bequest. Jane knows that as time evolves, she can modify her plan based on outcomes and life events.
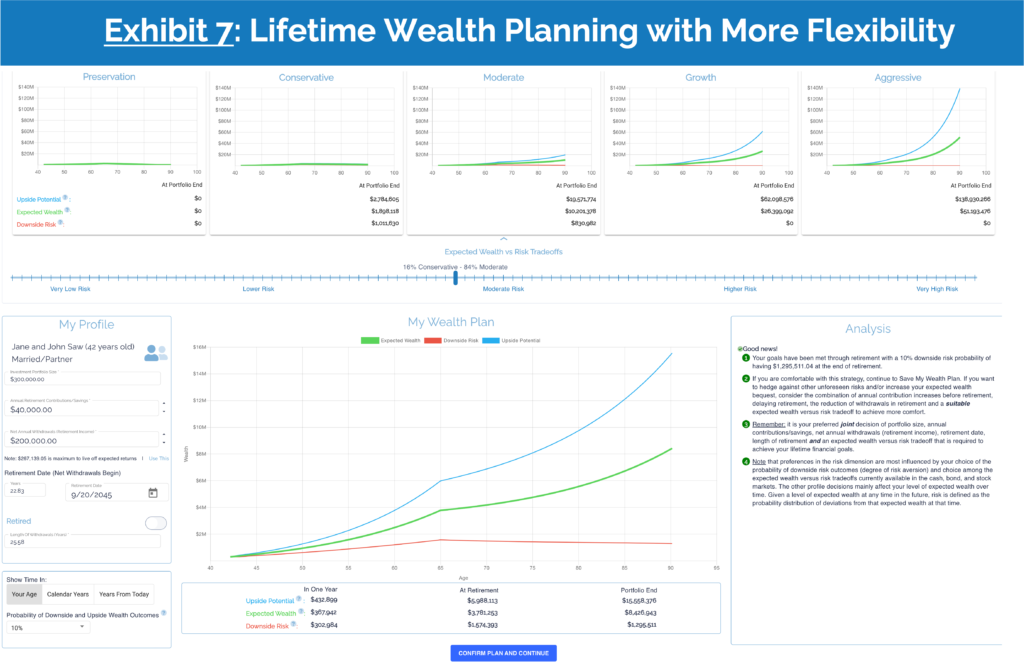
Then Jane clicks on CONFIRM PLAN AND CONTINUE.
Through the process of determining a Lifetime Wealth Plan, Jane implicitly revealed her investment preference from the efficient frontier of asset allocations. The frontier was derived with the forward-looking expected return, standard deviation and correlation matrix of cash, bond, and stock portfolios.[7] This strategy is called a strategic asset allocation or benchmark portfolio comprised of low-cost, well-diversified, tradeable, index ETFs and/or index mutual funds that can satisfy your investment objectives without any special information.
Jane’s onboarding selection is in MY PLAN/BENCHMARK, but with much more detail. This is where Jane will work on her plan from now on. You can modify your profile and investment opportunities between US Centric, Global Centric, and a Customize Benchmark Composition.
When viewing the Saw Family Balance Sheet in Exhibit 8, note the market value Portfolio Dashboard above it. The top line in the dashboard is the current Saw family investment portfolio characteristics and the second line is the market value characteristics of the benchmark strategy from MY PLAN/BENCHMARK.
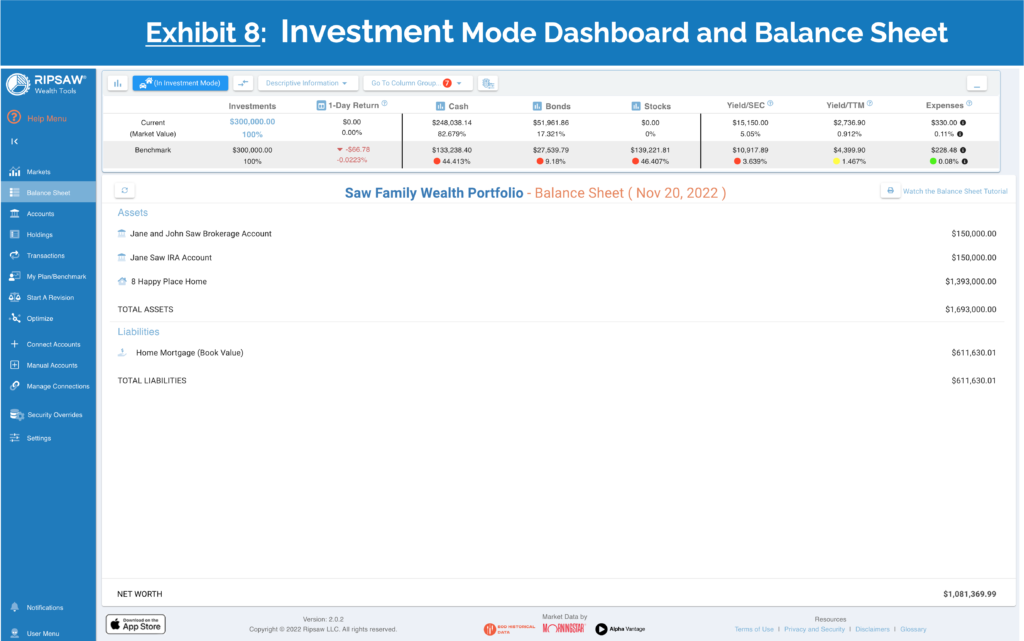
The current Saw family cash, bond and stock risk exposures are far from their benchmark strategy. The dashboard is showing the descriptive information. The dropdown menu can be used to observe the stock and bond details. There are 33 bond and 20 stock sub portfolio risk exposures available for comparison with Jane’s benchmark strategy. The Optimizer and Assist tools can now be used in portfolio revision mode to get as close as possible to all 56 risk dimensions of the benchmark strategy with or without tactical trade decisions and other constraints.
[1] https://www.cfp.net/why-cfp-certification/career-guide/what-is-financial-planning
[2] Efficient frontier refers to those portfolio strategies that for each level of expected return from lowest to highest, has the minimum risk (standard deviation of portfolio returns) without allowing short sales. US centric means the stock portfolio is a fixed 80%US/20% non-US composition. There is a much larger weight for non-US stocks and bonds in a global centric portfolio. After finishing onboarding, the choice of diversified funds used to construct the efficient frontier extends to a Global centric or custom option within the My Plan/Benchmark section of Ripsaw Wealth ToolsTM.
[3] Above the long-term average risk in the market is consistent with the market requiring a higher expected risk premium than average on risky assets. Below the long-term average risk in the market is consistent with the market demanding a lower expected risk premium than average. Spikes in uncertainty are likely to be resolved within a year. Beyond a year, the methodology employs a long-term market risk versus expected return profile. See https://www.ripsaw.co/2022/05/01/analyzing-the-markets-with-stanley-j-kon-phd/ for details.
[4] All annual inputs are converted to monthly units and then compounded for results.
[5] Below the input for Net Annual Withdrawals (Retirement Income), there is a note for making this input the maximum to just live off expected portfolio returns. This will result in an expected wealth horizontal line after retirement. Just spend on what your portfolio expects to earn. This is like those people that feel more secure when they say don’t touch the principal of their savings (no risk thought), but planning for spending what your portfolio expected returns does have downside risk.
[6] The way to verify this observation is to look at any point prior to 84 years old. You can confirm that the distance between expected wealth and downside risk is identical to the distance between expected wealth and upside potential. The highest 5% of outcomes and lowest 5% of outcomes are symmetrical around expected wealth. At 84, Jane hits a downside risk barrier of $0.00. Hence, the term “risk of ruin.” Beyond that year, the symmetry would involve negative values for the expected wealth of the 5% worst outcomes. Since negative money does not make sense in this application, the zero barrier is enforced, and symmetry beyond 84 years old no longer exists.
[7] Cash has a positive standard deviation and correlation with other securities from including reinvestment risk.