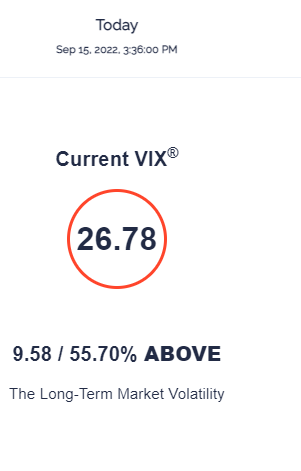
The Market Analysis Tool Indicates the volatility of the market and displays an index (VIX index) based on the severity of volatility.
This tool displays information using five sections. These include Stocks, Bonds, US Yield Curve, Crypto and Daily Performance. Each section comprises of charts, diagrams and tables with detailed financial information on the market.
Stocks

This is the default section in the tool and shows an analysis of the US stock market. These include:
- VIX index
- Forward Looking Stock Market Analysis
- Expected Return vs Total Volatility (Risk)
- Stock Return Correlation Matrix with Decomposition
- Forward Looking Stock Market Analysis by Sector
- Stock Sector Return Correlation Matrix with Decomposition
Bonds
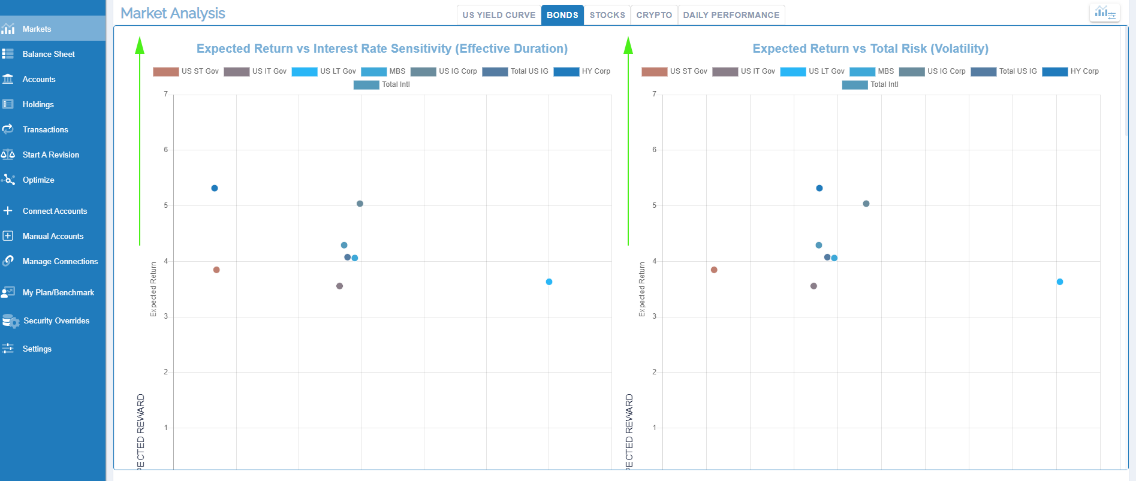
This section shows an analysis of the US Bonds market. These include:
- Charts
- Expected Return vs Interest Rate Sensitivity (Effective Duration)
- Expect Return vs Total Risk (Volatility)
- Forward-Looking Expected Return and Risk
- Bond Sector Return Correlation Matrix
US Yield Curve
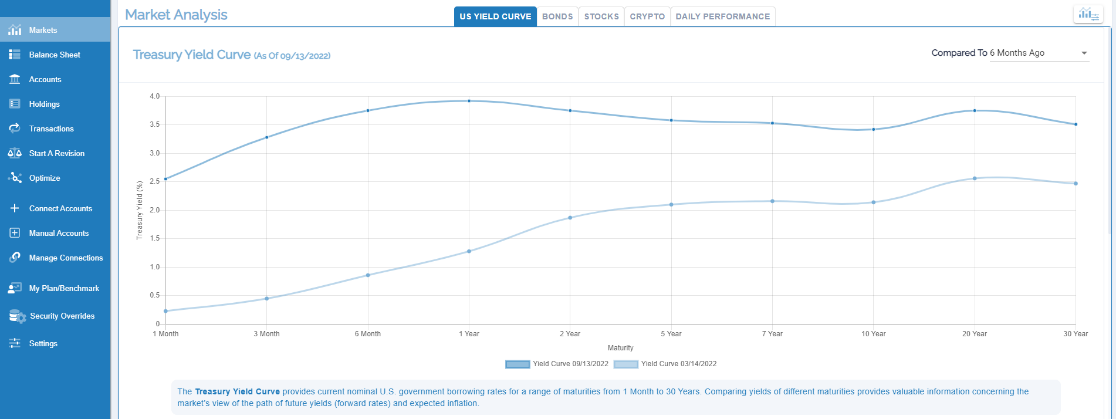
This section displays the interest rate information. These include:
- Short-term rates
- Long-term rates
- Treasury Yield Curve
- Treasury Yields and Risk
Crypto
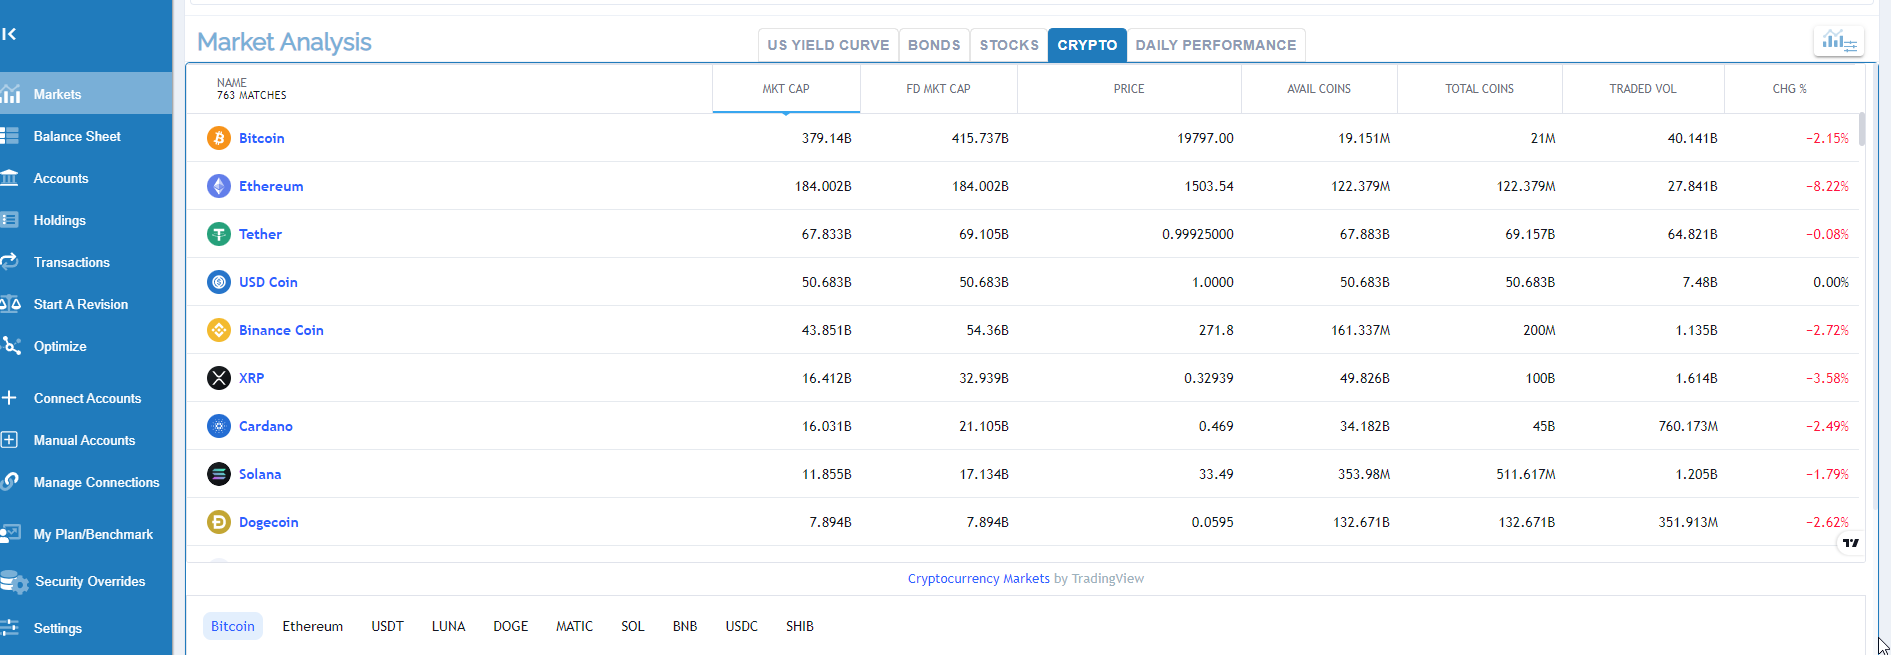
This section shows an analysis of the Crypto market.
Daily Performance
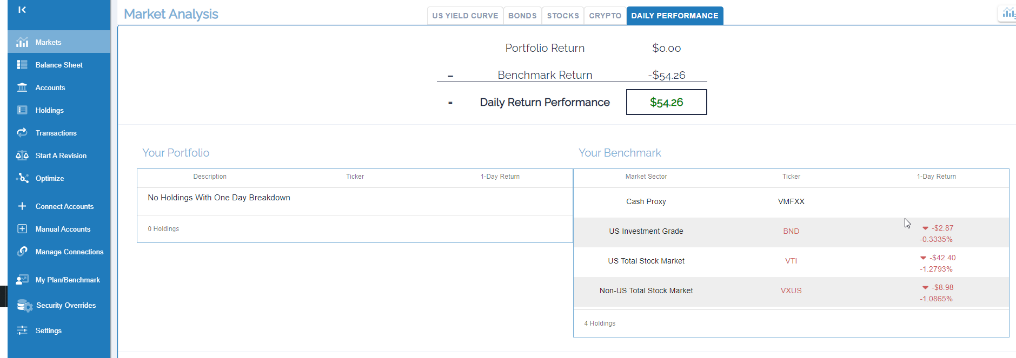
This section displays the user’s daily performance versus their benchmark (portfolio to measure against) and the breakdown of contributors to your daily performance.