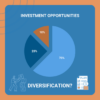
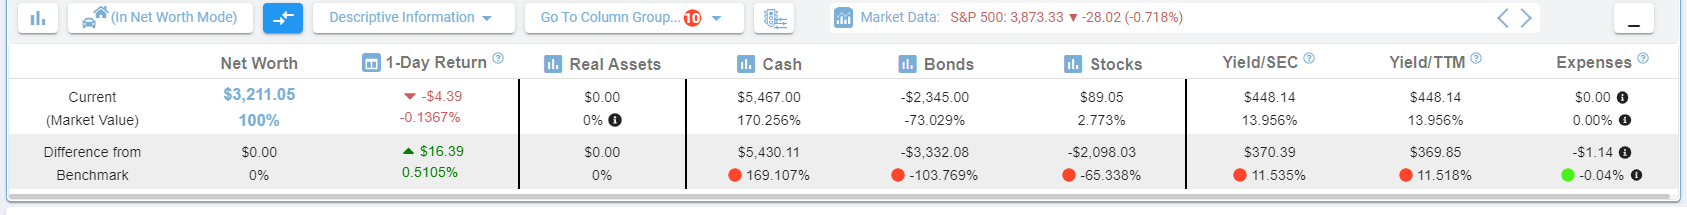
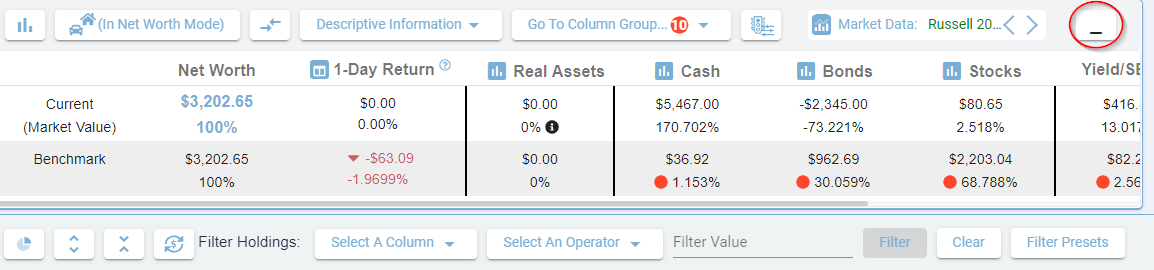
This wealth portfolio dashboard is a handy tool available in the Balance Sheet, Accounts and Holdings tabs. It allows the user to see how far they are from the benchmark in various categories. The dashboard displays market & benchmark values and deviation percentages for:
- Net Worth / Investments
- 1-Day Return
- Real Assets
- Cash
- Bonds
- Stocks
- Yield/SEC
- Yield/TTM
- Expenses
Wealth Portfolio Deviation Indicators
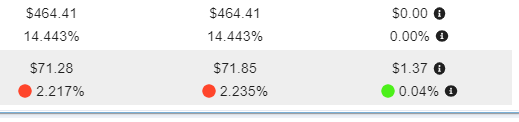
There are color-coded percentages on the dashboard known as deviation indicators. These indicate the deviation from the benchmark.
- Red represents a large deviation
- Green represents a deviation below the threshold
Wealth Portfolio Charts
Show Charts
![]()
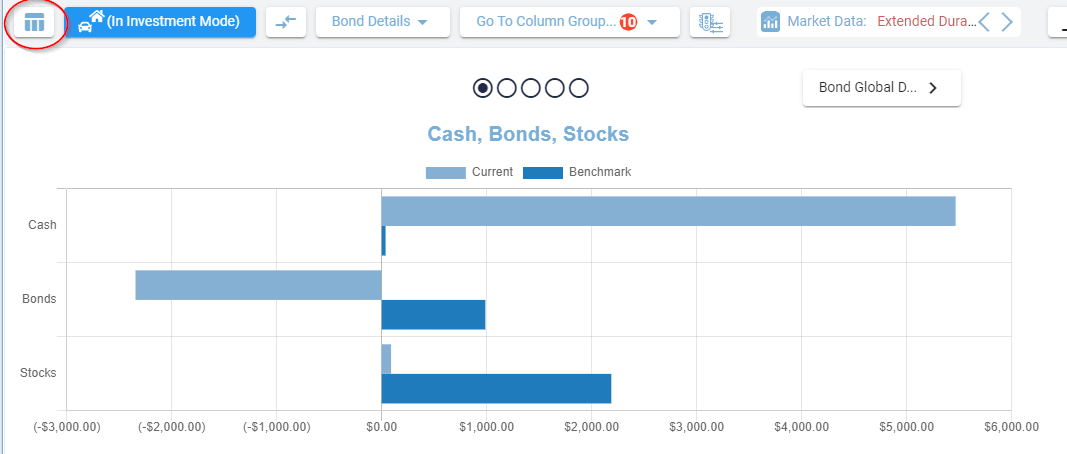
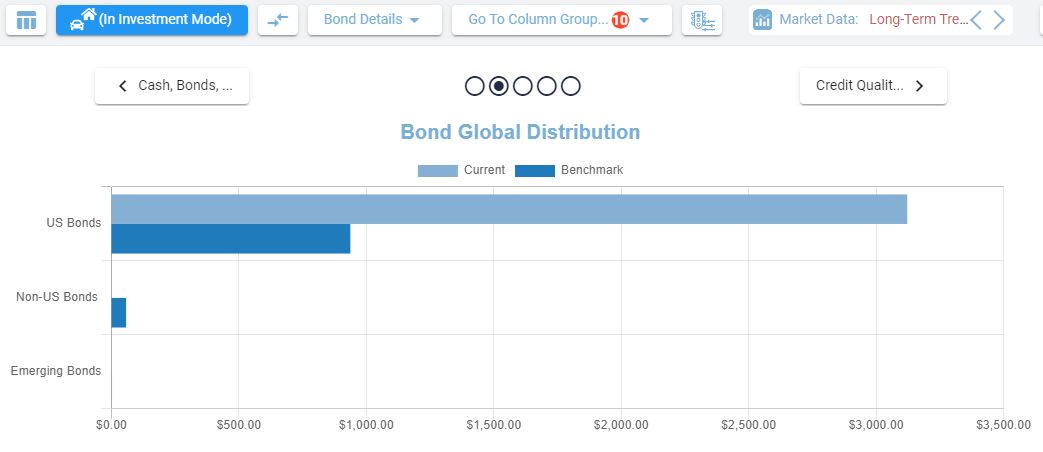
This button is used to show financial charts. All graphs show a comparison between the user’s portfolio and their benchmark.
Show Tables
![]()
This button is used to return to the table view.
Types of Charts
Cash, Bonds, Stocks
Bond Global Distribution
Credit Quality Distribution

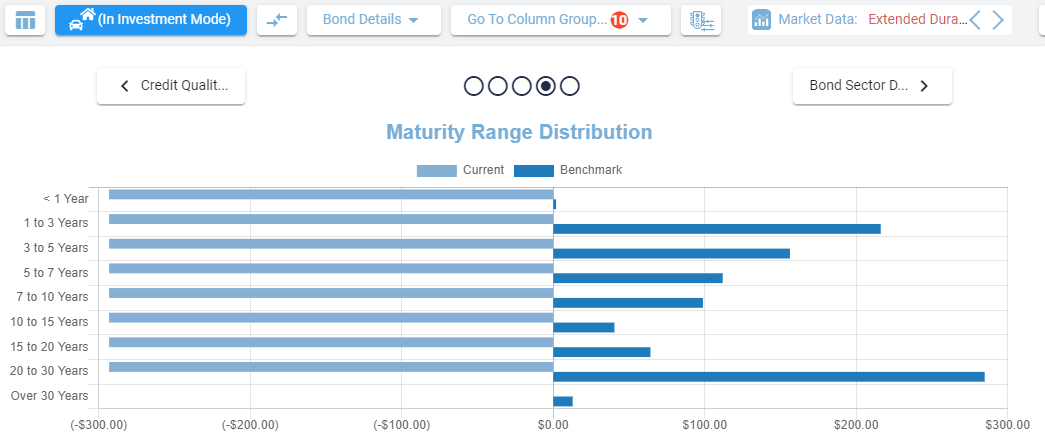
Mature Range Distribution
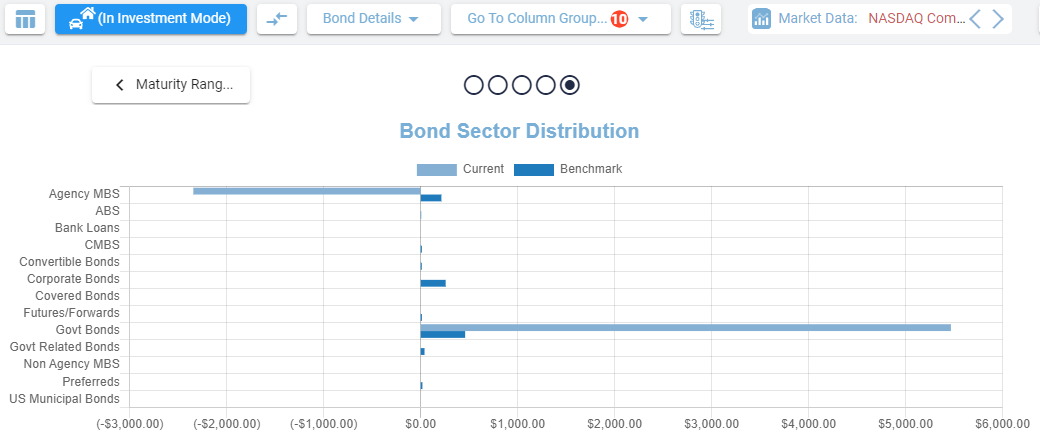
Bond Sector Distribution
Wealth Portfolio Modes
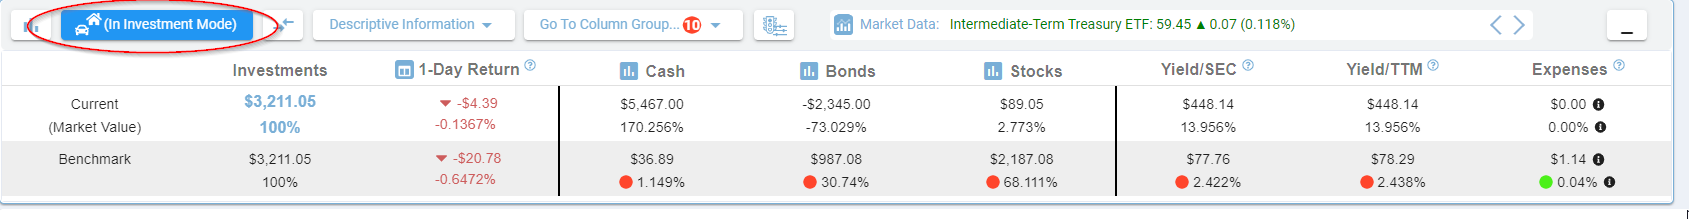
This setting is used to switch between Investment and Net Worth mode.
Investment Mode
Net Worth Mode
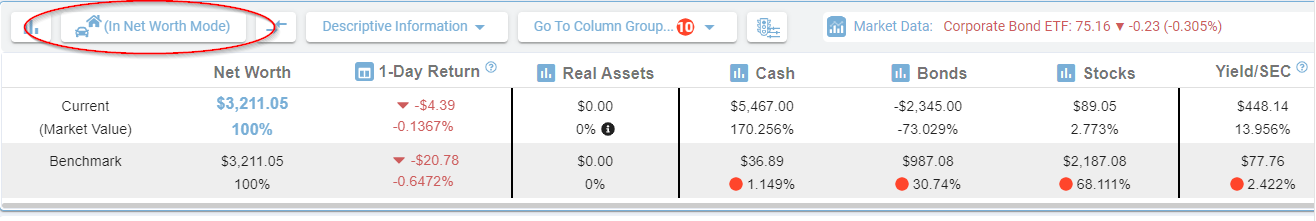
This mode adds an extra column known as “Real Assets.”
Benchmark Difference
![]()
This button is used to show the difference between the benchmark and your portfolio
Information Display
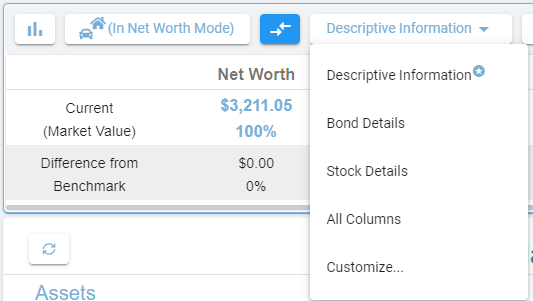
This button allows information to be viewed in different detail
Descriptive Information
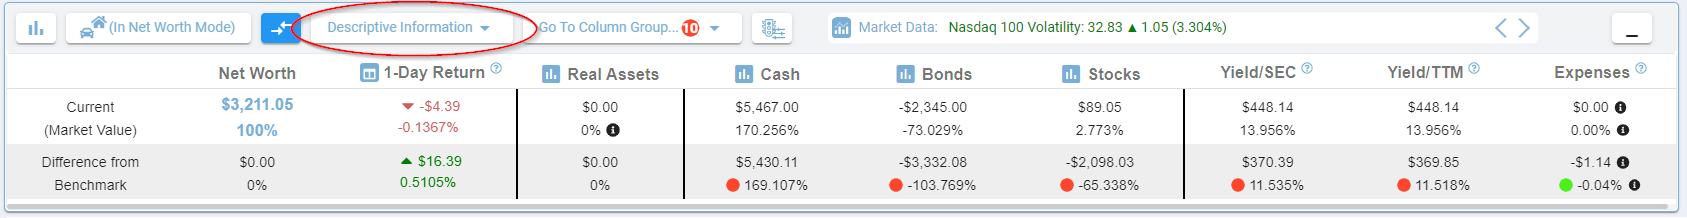
This is the default view and displays Yields and Expenses.
Bond Details
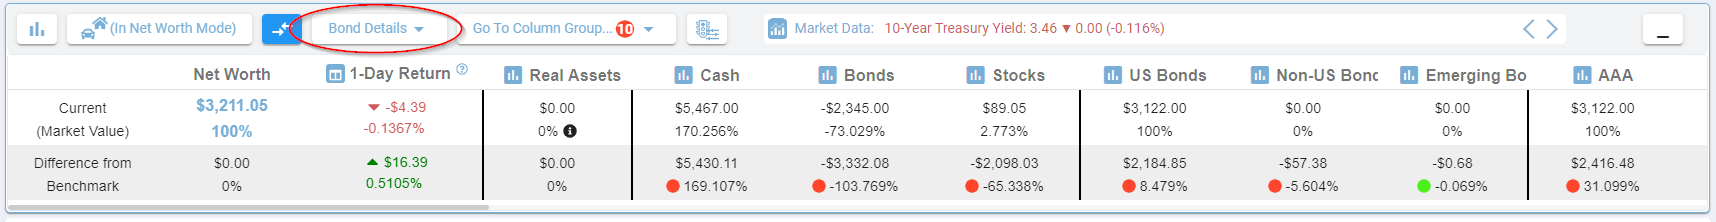
This view displays columns relating to Bonds.
Stock Details
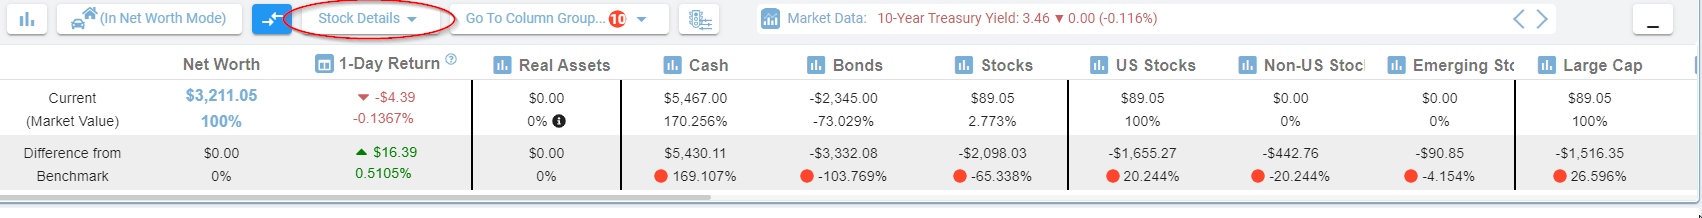
This view displays columns relating to Stocks.
All Columns
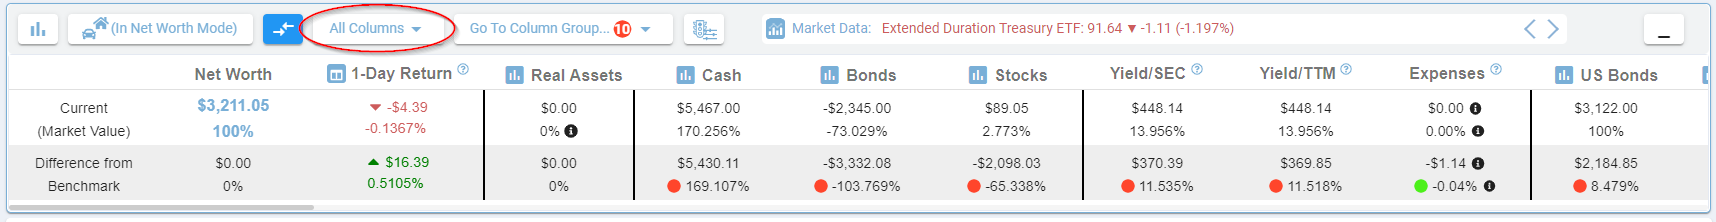
This setting will show all columns available in the dashboard.
Customize
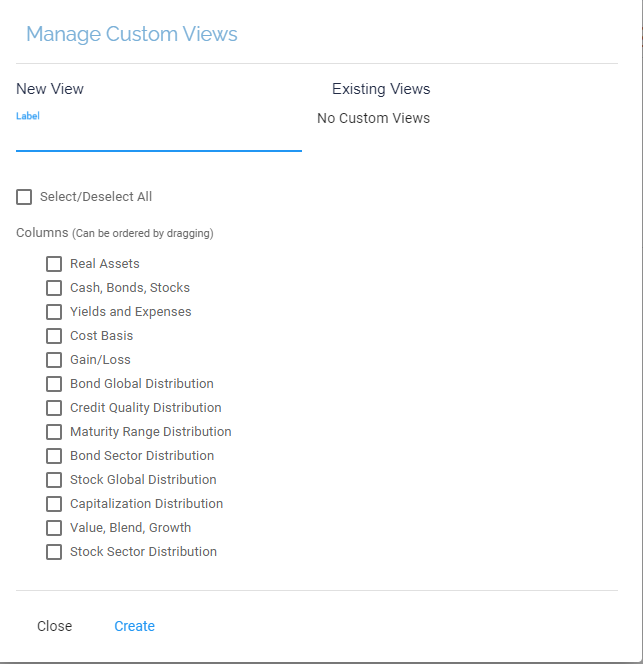
This setting allows you to choose which columns to display on the dashboard.
Scrolling Shortcuts

This setting offers the user options to jump to a specific group of columns.
Example
Based on the above photo, clicking “Bond Global Distribution” would fill the dashboard with columns relating to US Bonds.
Deviation Threshold Settings
![]()
This button takes the user to the deviation threshold settings.
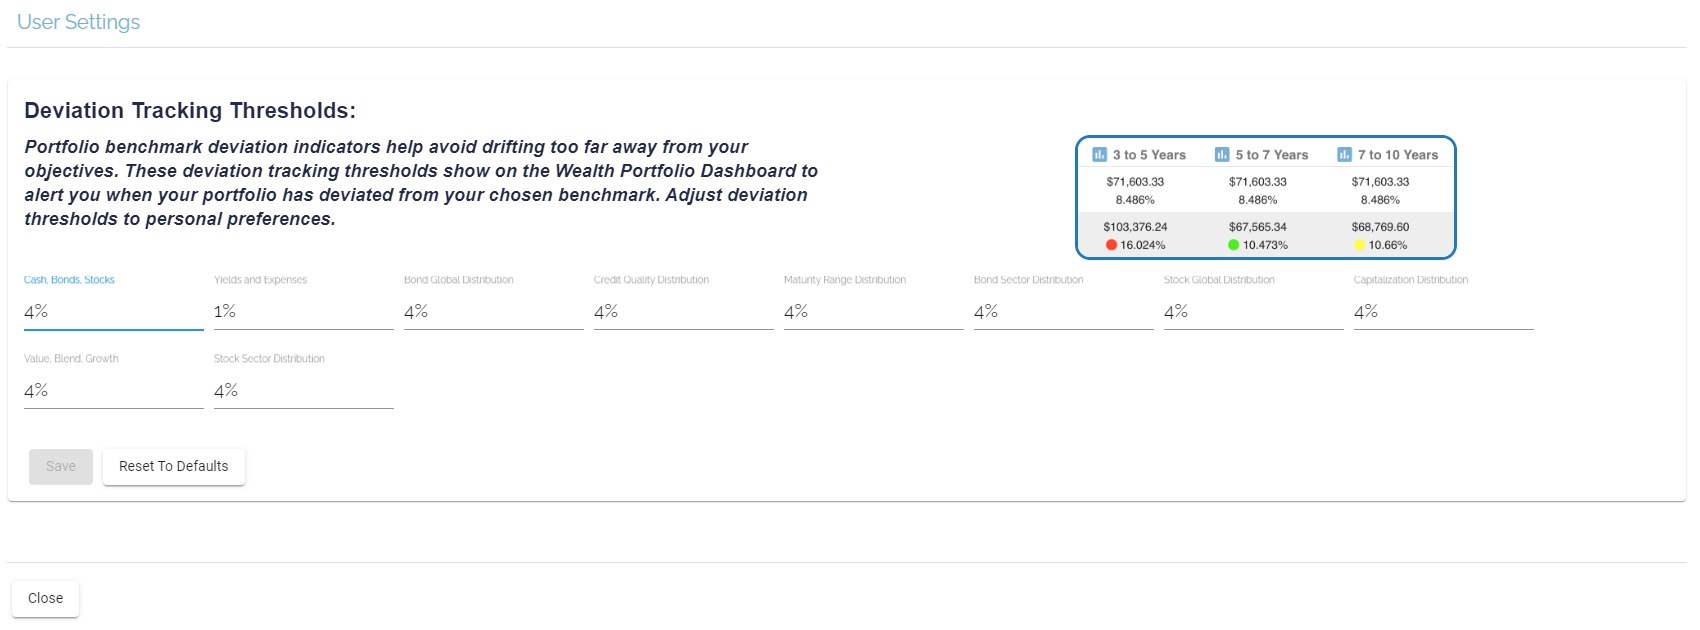
This setting allows you to change the deviation threshold settings.
Dashboard Display
Minimize Dashboard
![]()
This button hides the dashboard information.
The button appears in the top-right section when the dashboard is visible.
Restore Dashboard
![]()
This button shows the dashboard information.

The button appears in the top-right section when the full dashboard is not visible.