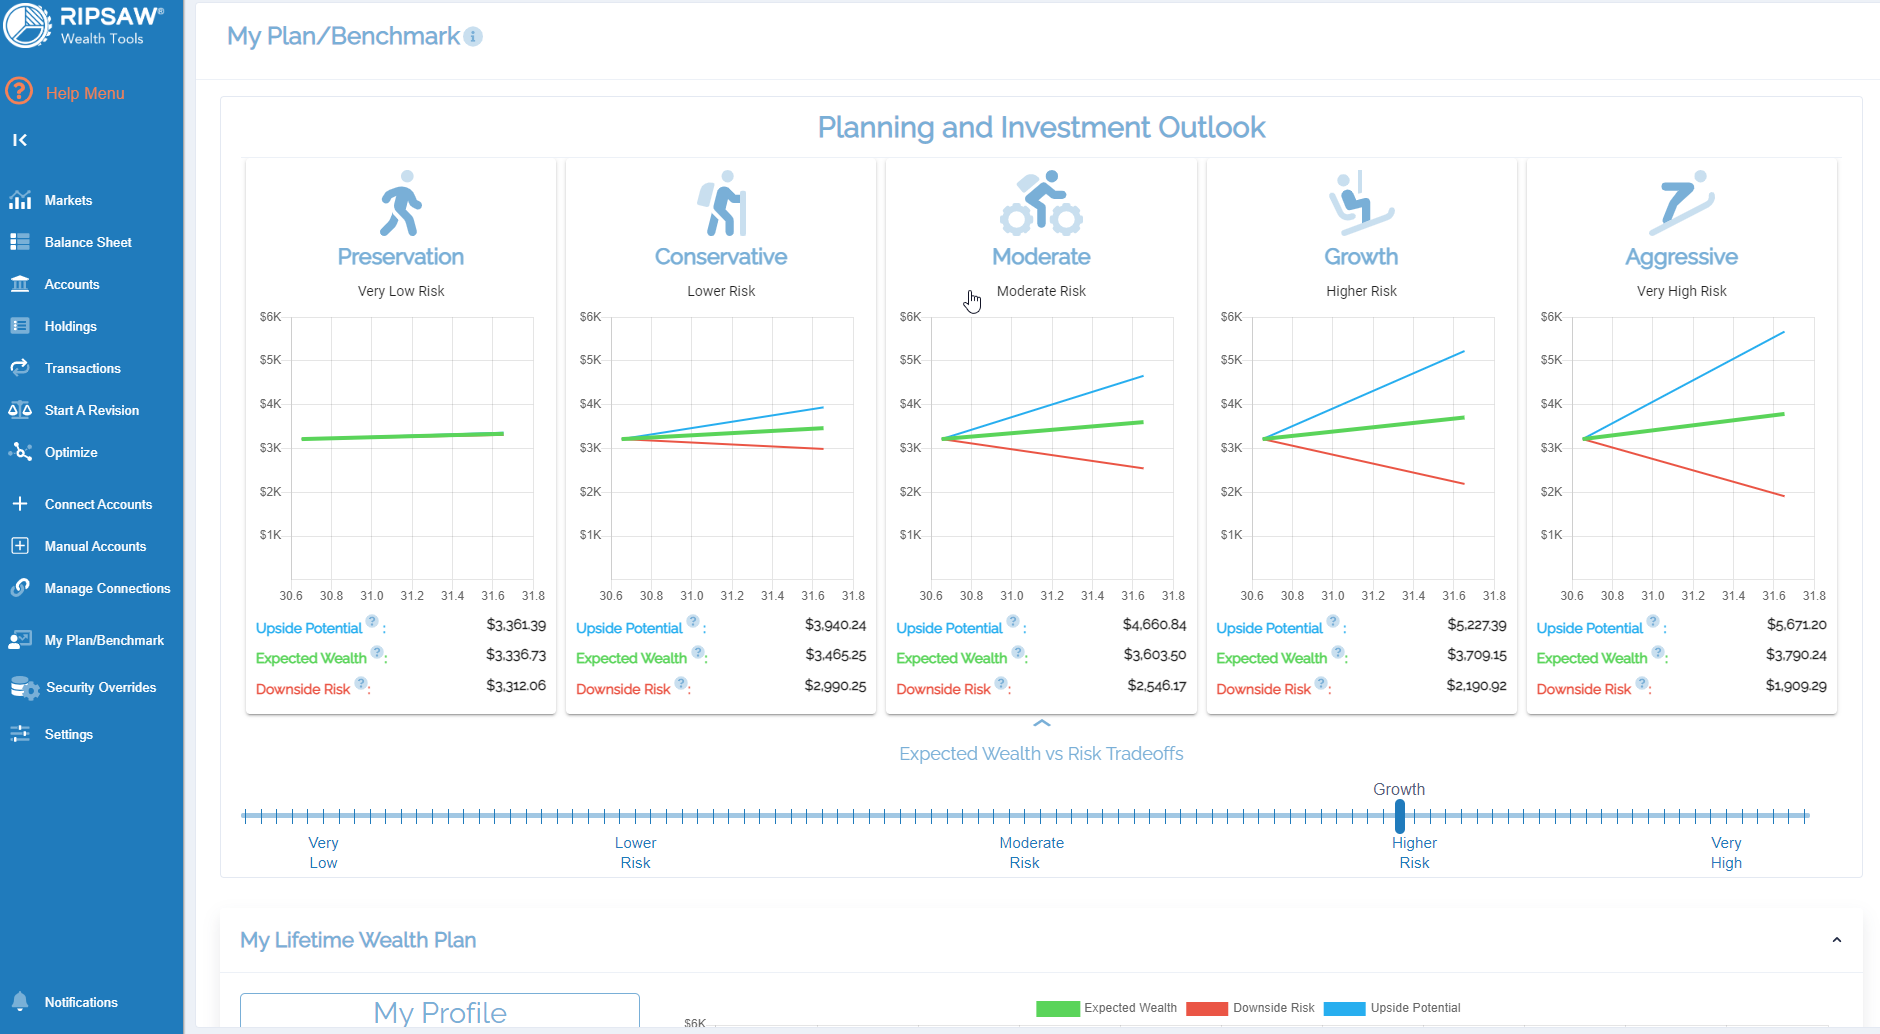
This tab allows the user to customize and view their benchmark. They are five preset profiles that a user can use based on their investment strategy.
- Preservation
- Conservation
- Moderate
- Growth
- Aggressive

Preservation provides the least risk but may not result in as much rewards as the higher tiers. As the tiers become more aggressive, the risks increase. Aggressive provides the highest risk with potentially the highest reward. Each tier adjusts the asset allocation. These presets are affected based on information provided by the user in the Lifetime Wealth Plan.
The user can adjust the risks that they are willing to make manually by using a slider.

Lifetime Wealth Plan
This section allows the user to enter their financial details.
- Investment Portfolio Size
- Annual Retirement Contributions/Savings
- Net Annual Withdrawals (Retirement Income)
- Retirement Date
- Retirement Status
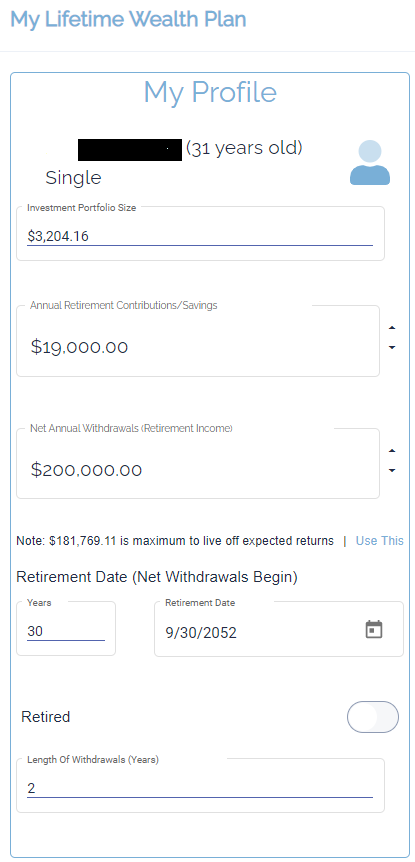
When entering the retirement date, the user can either enter the number of years until retirement or select a date. This is when the net withdrawals will commence.
The user can adjust various benchmark settings.
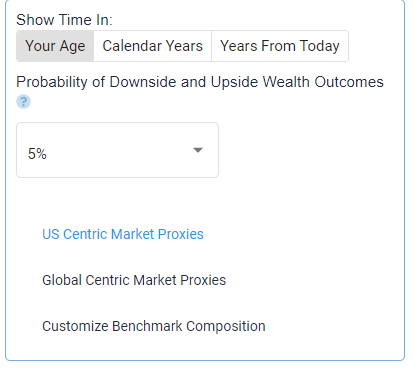
Time View
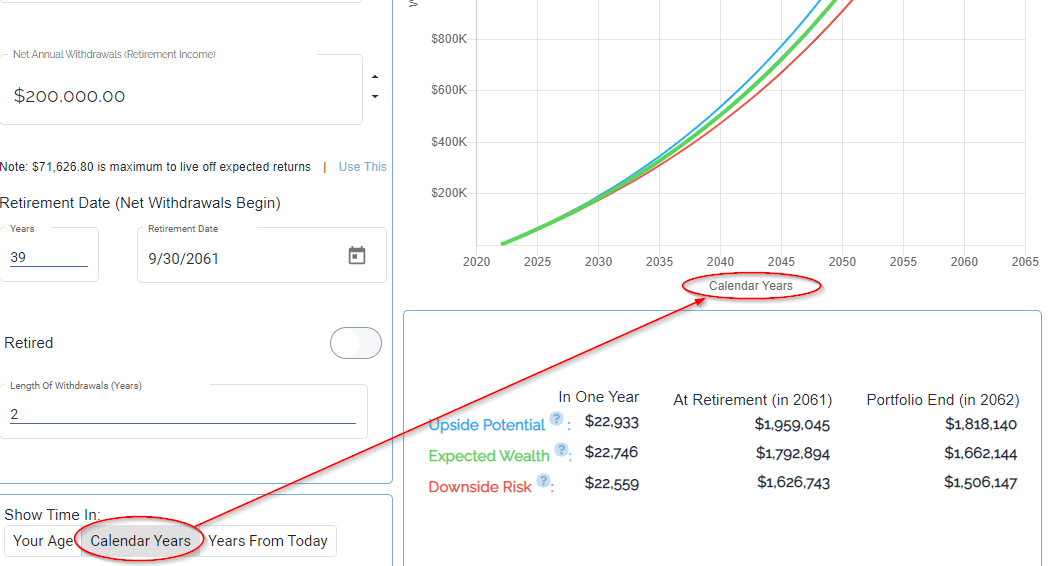
This represents how the user wants the wealth plan chart to be constructed. This chart can display data based on age, calendar years or the number of years until retirement.
Probability of Downside and Upside Wealth Outcomes
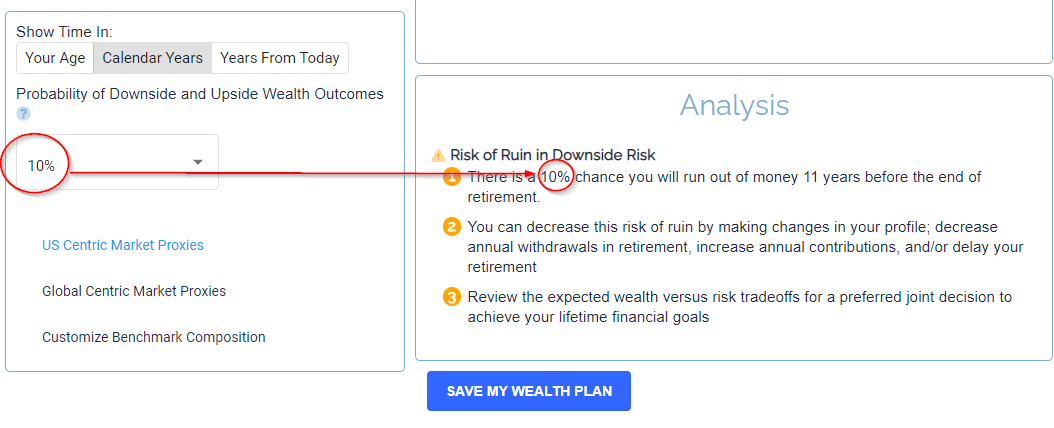
This setting provides a risk analysis based on a probability percentage of downside and upside wealth outcomes.
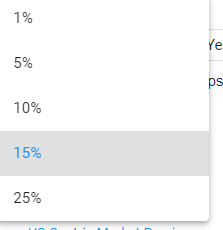
Select from an option of 1%, 5%, 10%, 15% or 25%.
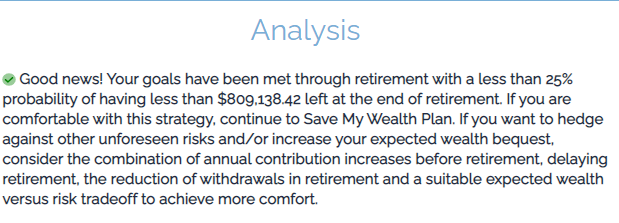
Once an appropriate percentage has been selected, the user will be notified of a successful choice.
Proxies

The user can choose to base their portfolio on the US market alone or the global market.
Customize Benchmark Composition
The user can use this setting to adjust proxy settings based on Cash, Bonds and Stock market sectors.
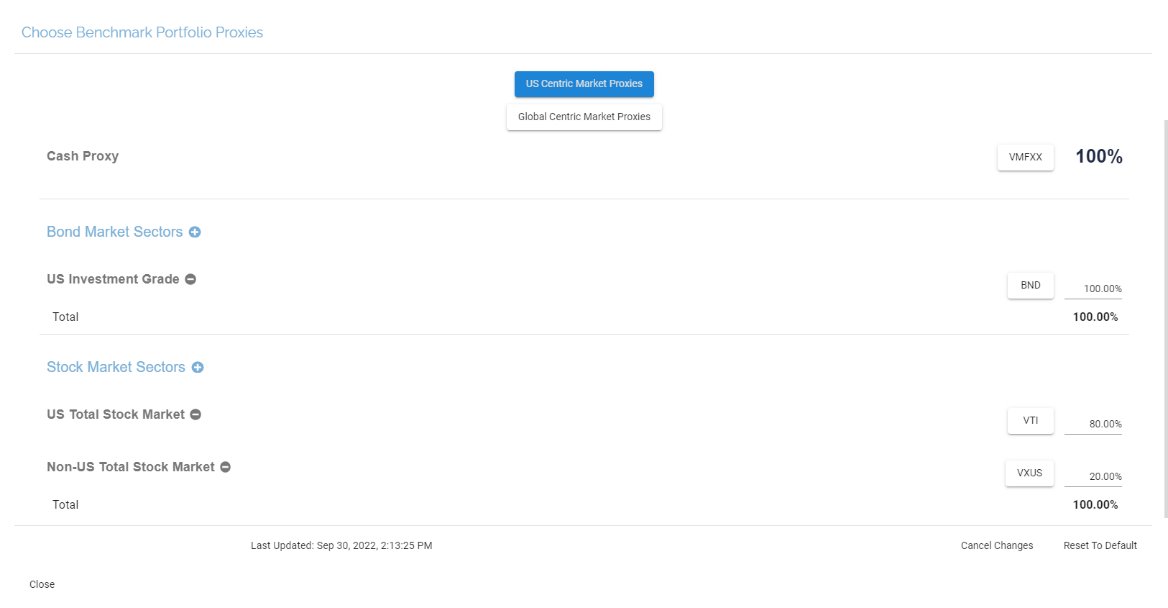
In the US Centric Market, the user can adjust:
- Cash Proxy
- Bond Market Sectors
- US investment Grade
- Non-US Investment Grade
- Emerging Market Bonds
- Stock Market Sectors
- US Total Stock Market
- Non-US Total Stock Market
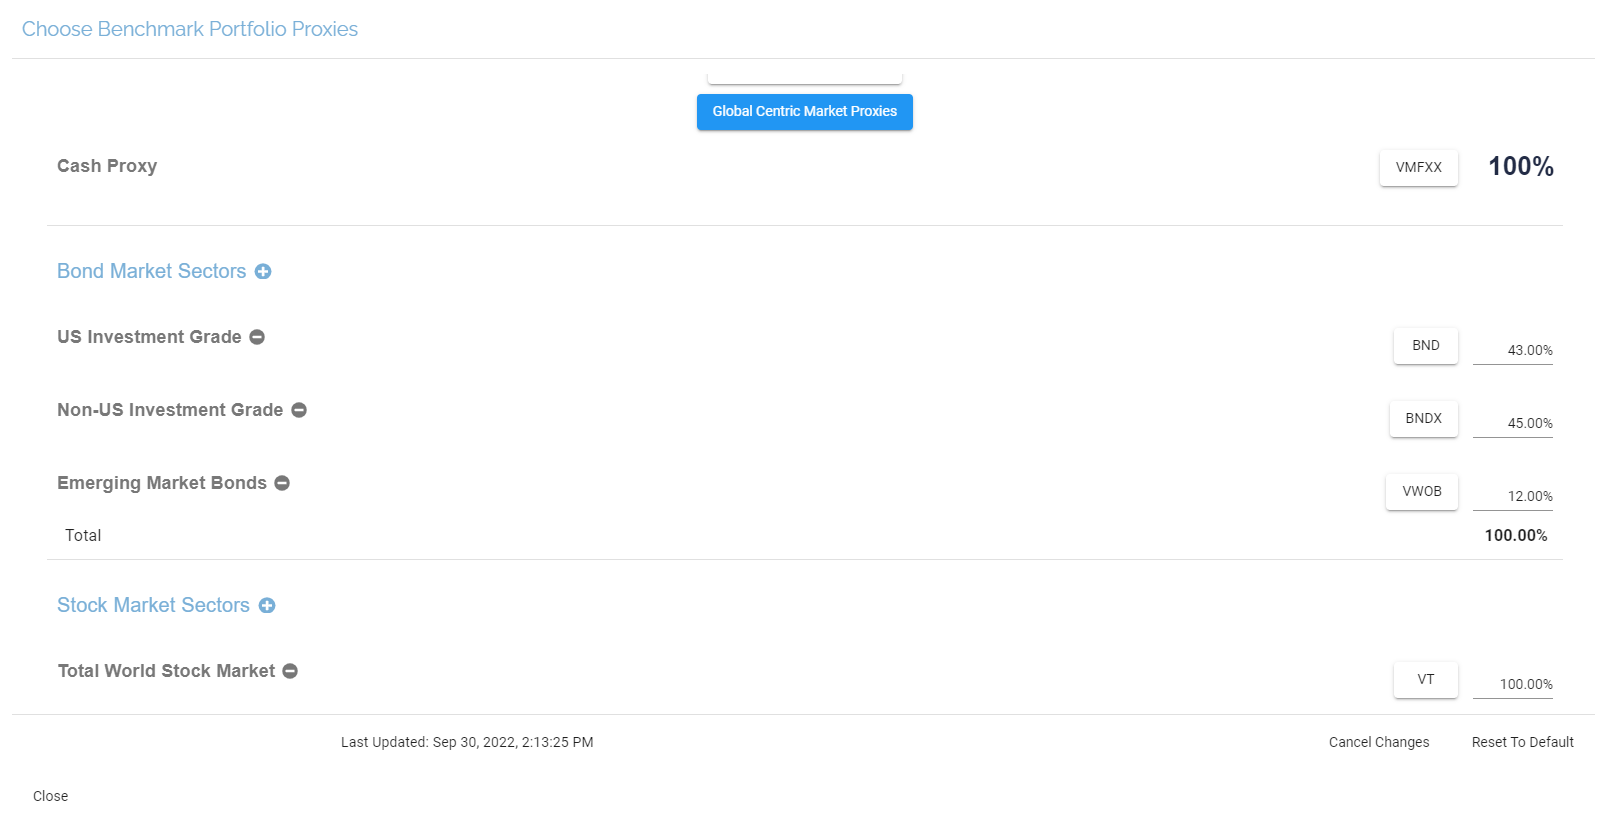
In the Global Centric Market, the user can adjust:
- Cash Proxy
- Bond Market Sectors
- US investment Grade
- Non-US Investment Grade
- Stock Market Sectors
- Total World Stock Market
Chart
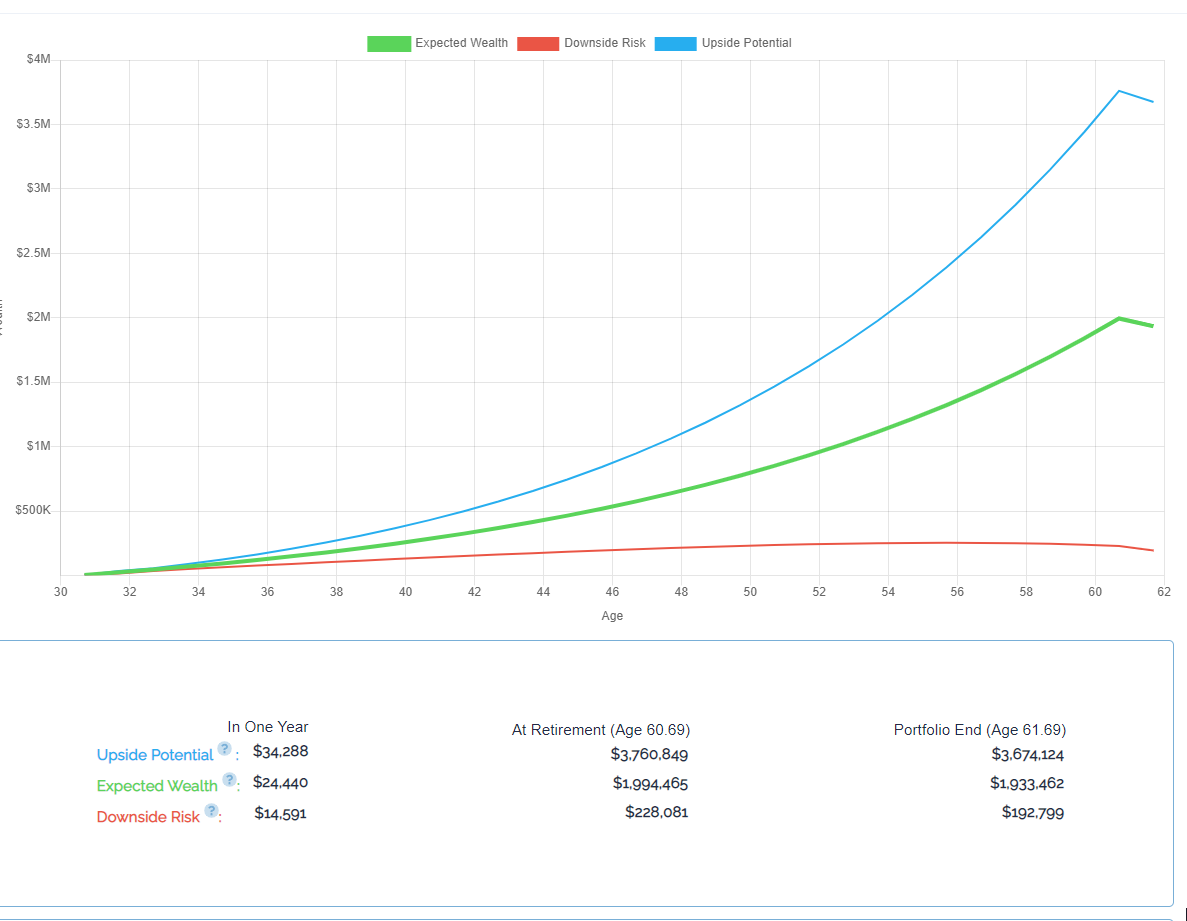
As the Wealth vs Risk adjustments are made, the chart in the Lifetime Wealth Plan reflects the expected result dynamically.
Saving

Upon completion of entering all benchmark information, the user can save their wealth plan.
Return and Volatility Details
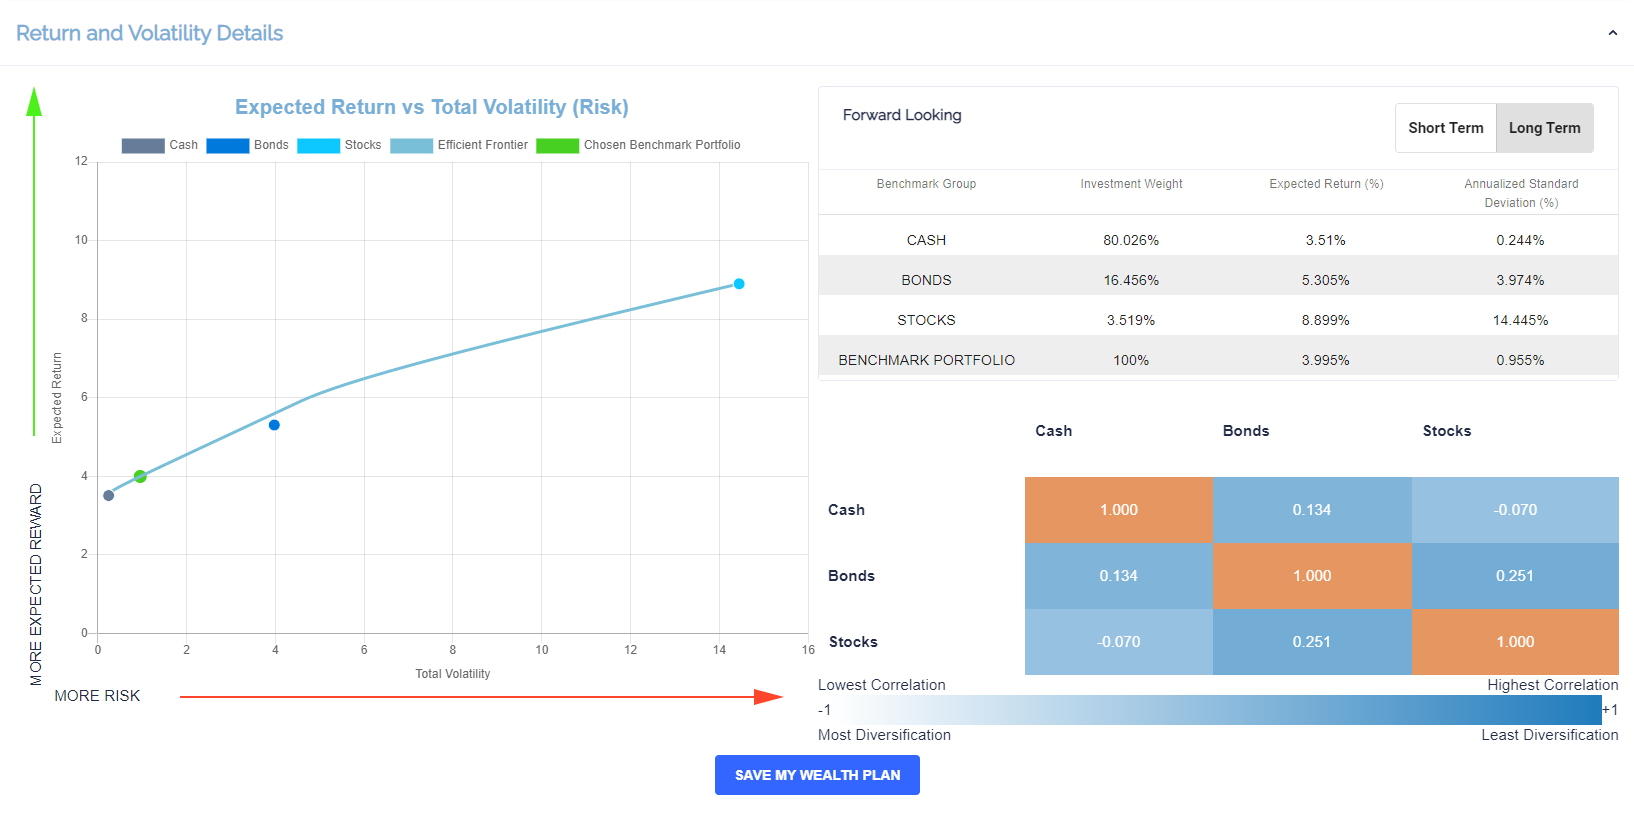
This section shows the expected return versus the risk. The data can be seen via a graph or a breakdown of investments within two tables. Information can be viewed from both a long-term and short-term perspective.
This section is adjusted based on the benchmark values entered by the user.
Benchmark Summary

This section shows a summary of the user’s benchmark portfolio based on their asset allocation. This changes as the values in the previous sections are edited.